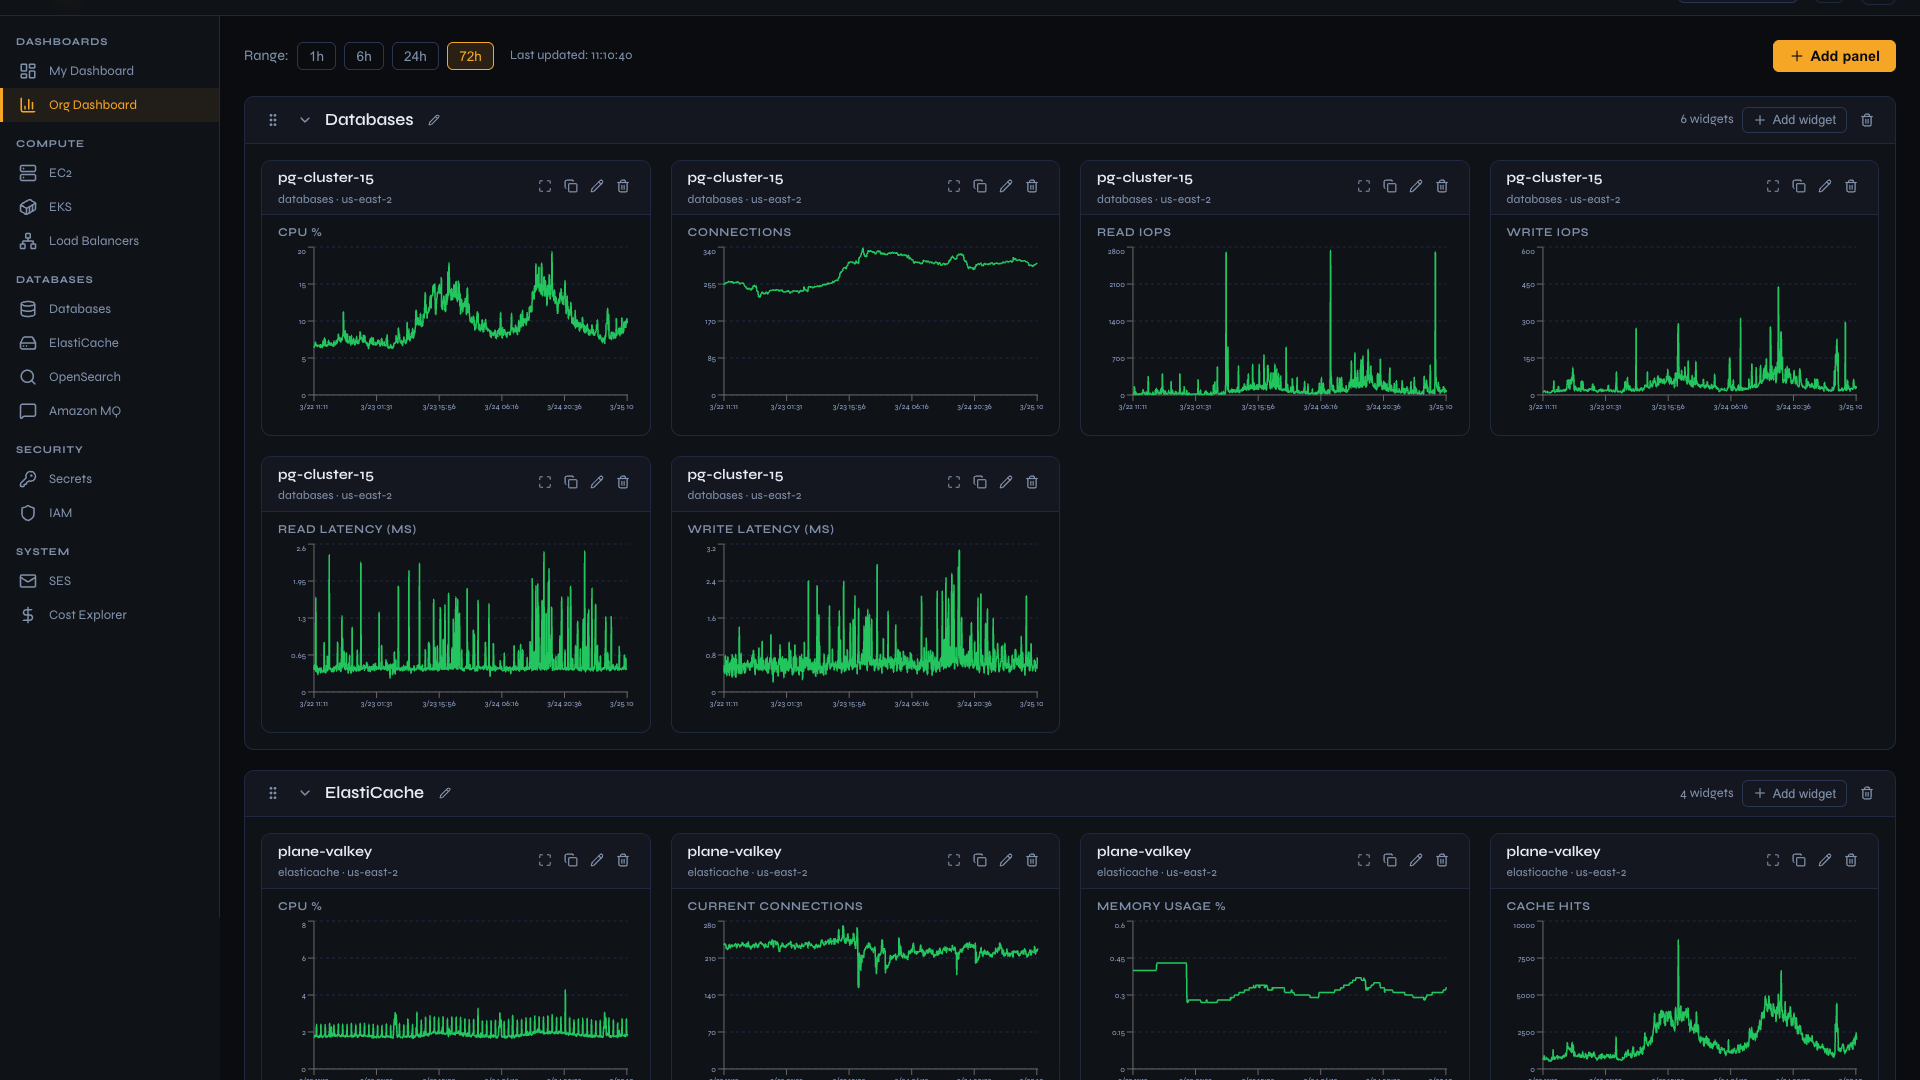
Real-time Monitoring & Dashboards
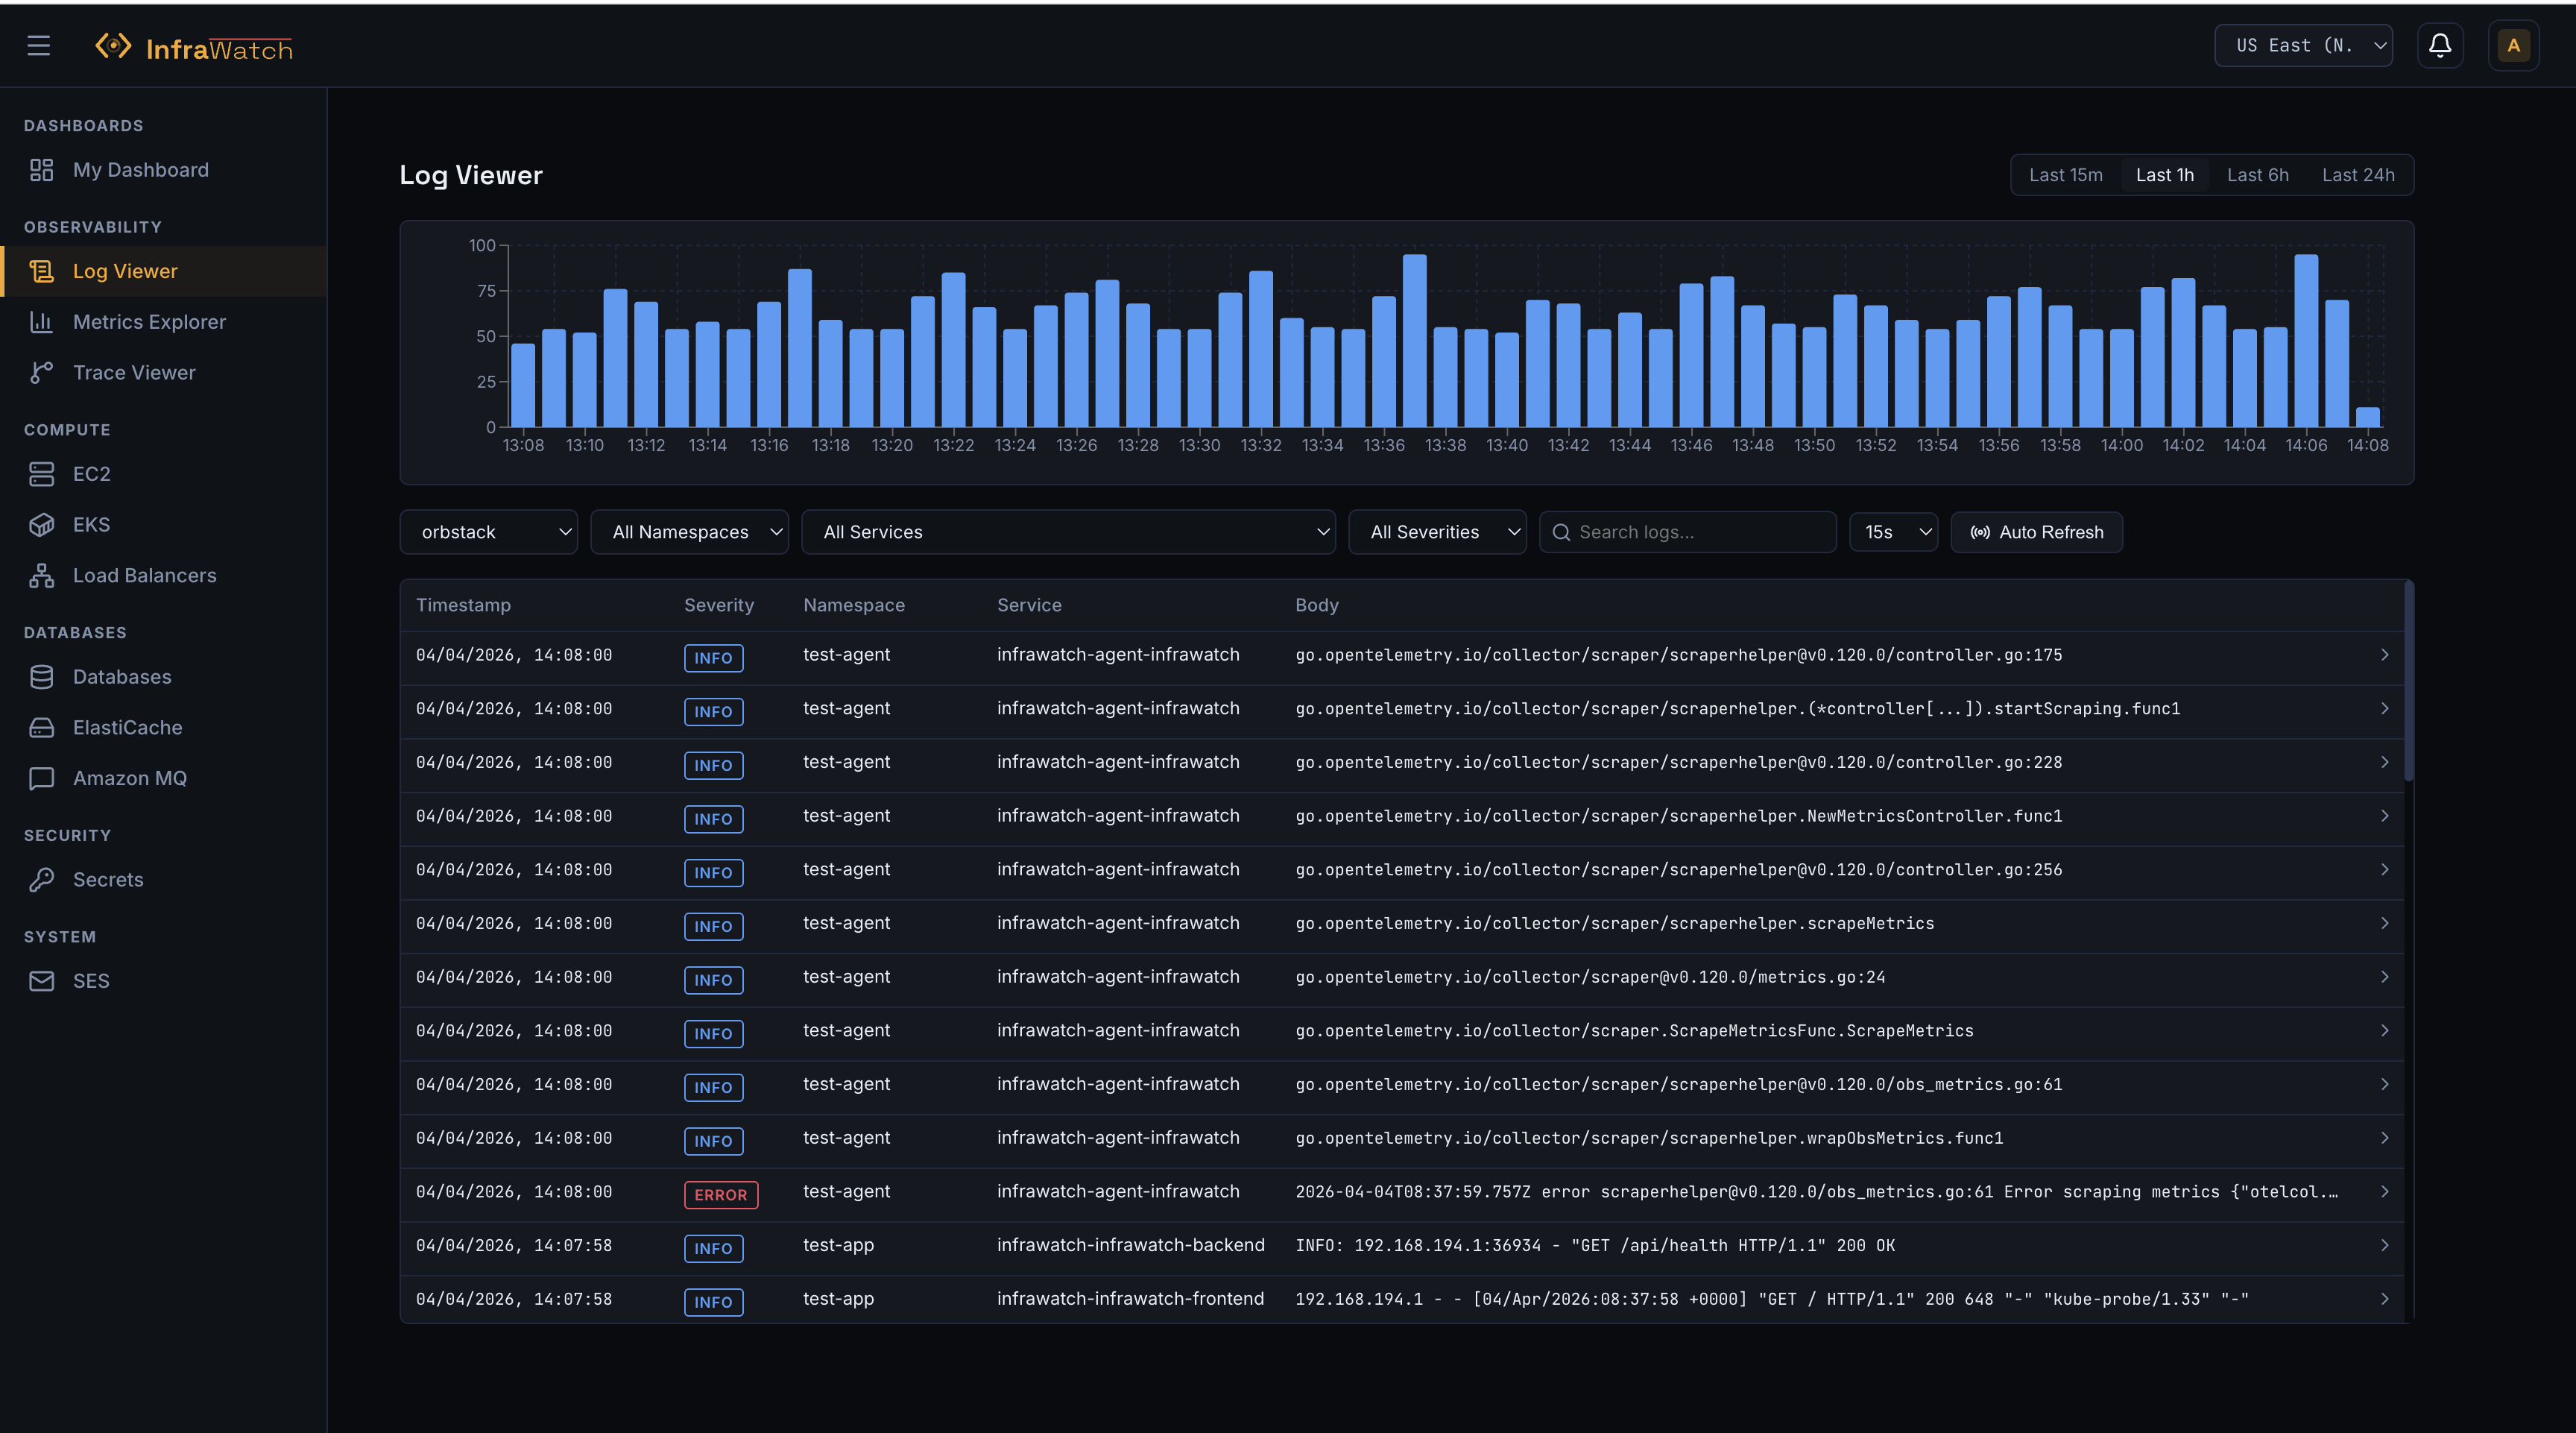
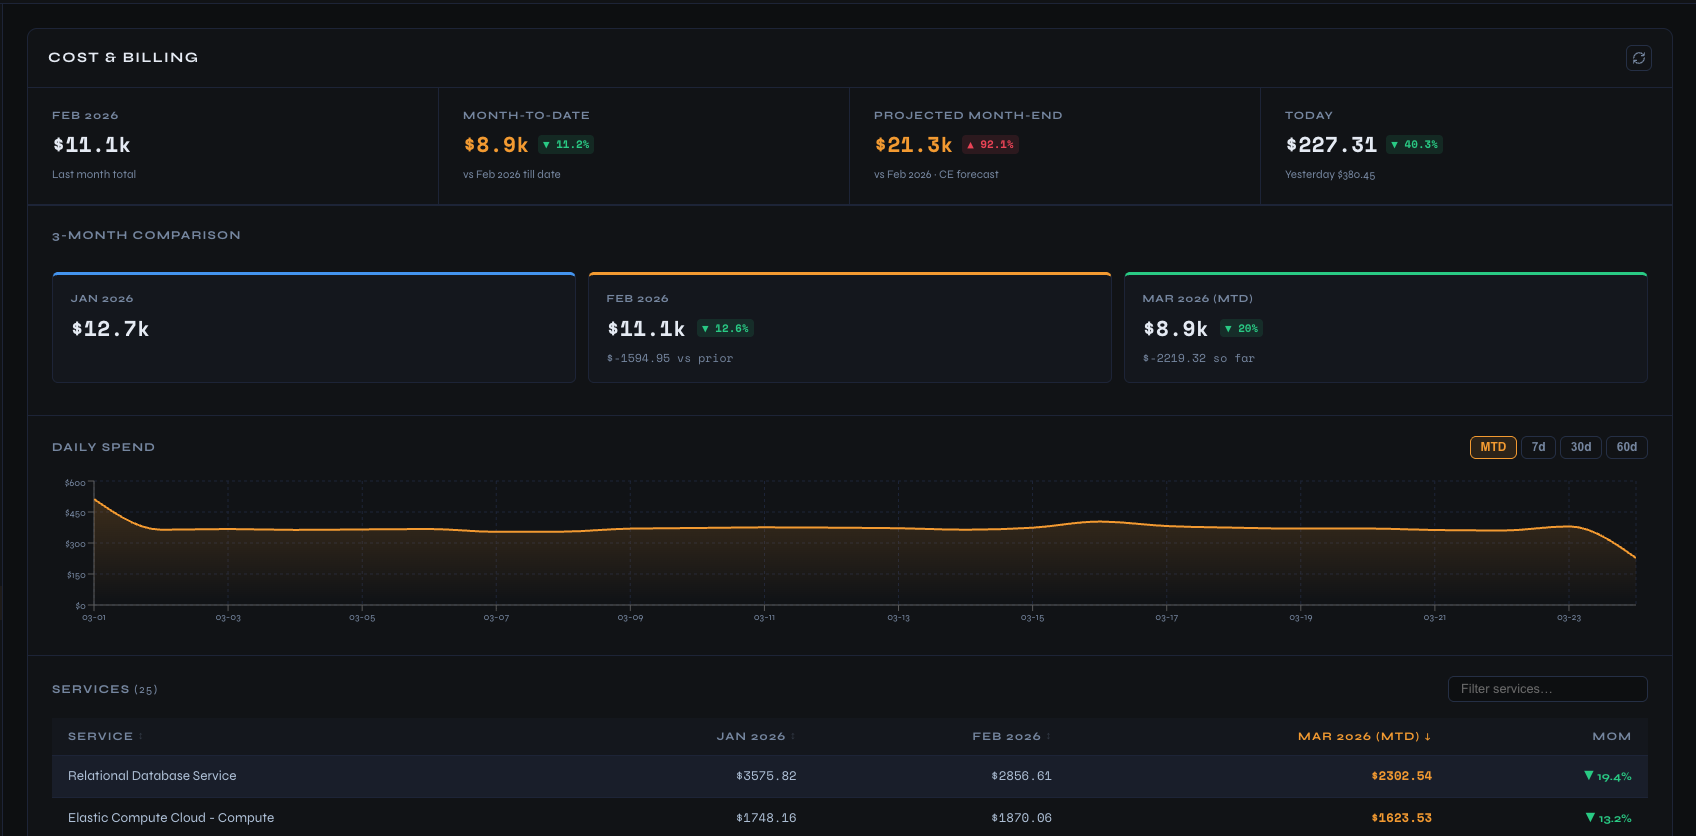
A unified dashboard with drag-and-drop metric panels for every AWS service you run. Databases, clusters, caches, load balancers, queues — all with live CloudWatch metrics, auto-refresh, and customizable layouts per user.
- Drag-and-drop panels with collapsible metric widgets
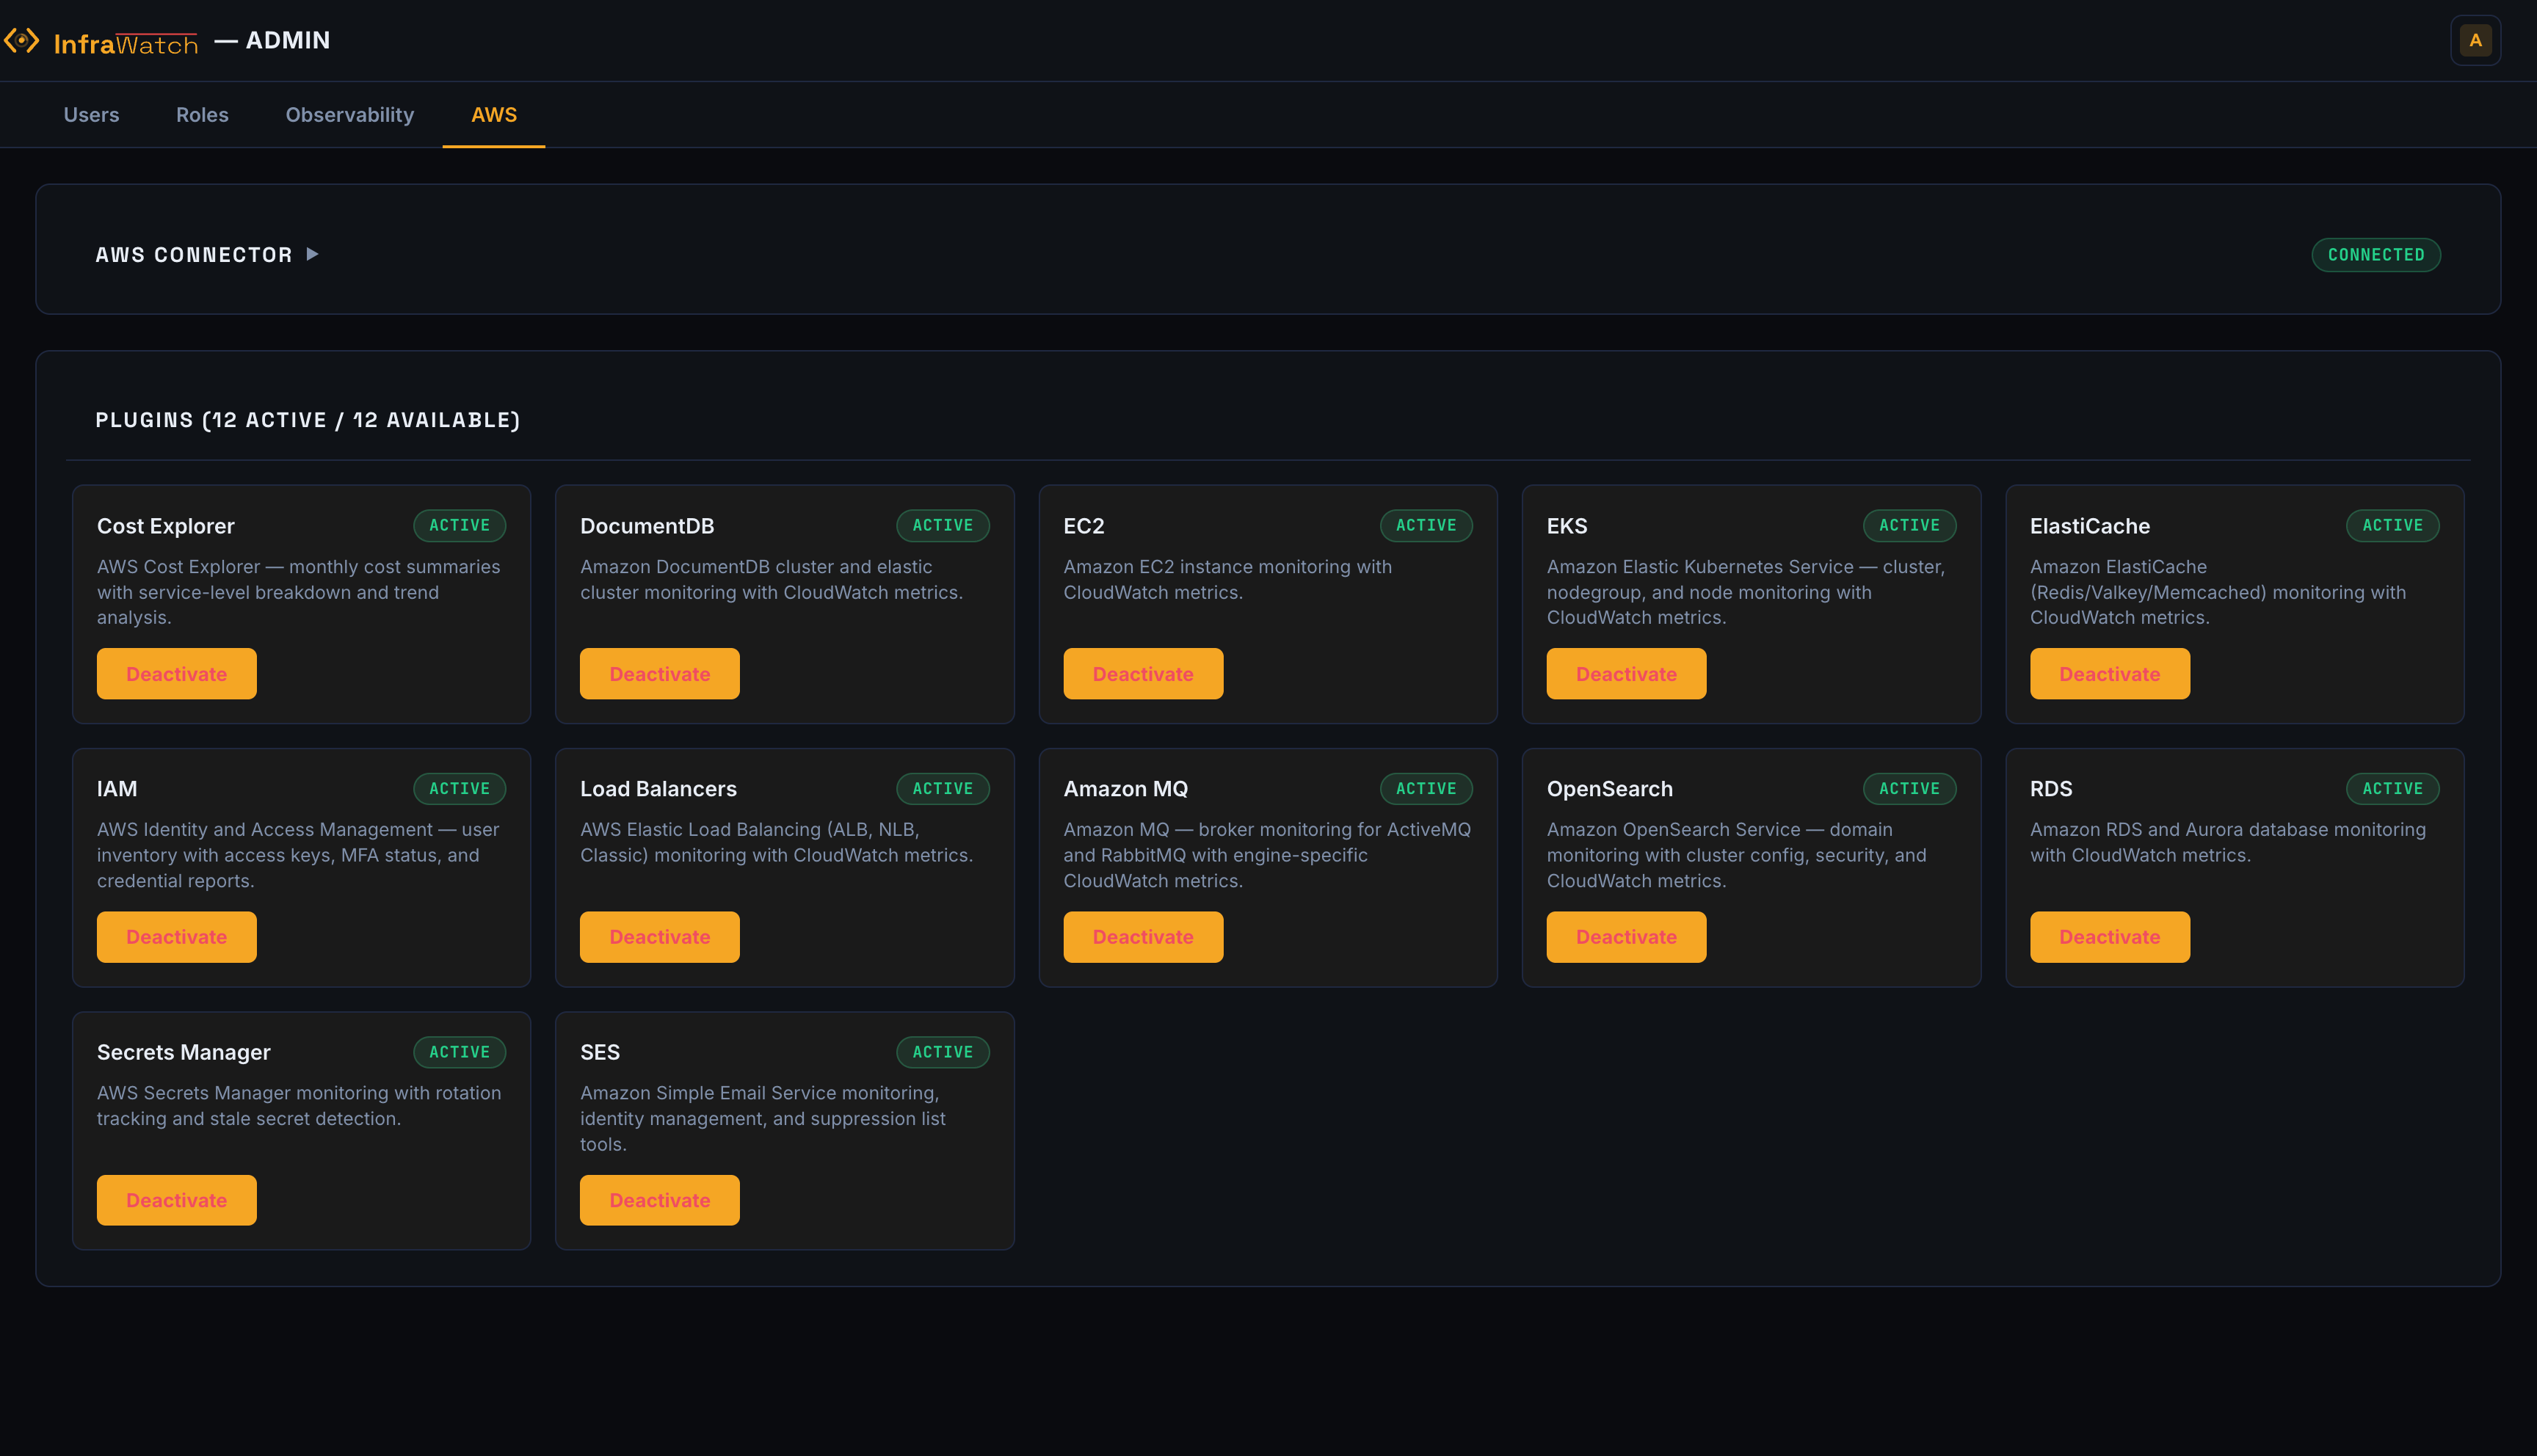
- 12+ AWS services monitored out of the box
- CloudWatch metrics with configurable time ranges (1h, 6h, 24h, 72h)
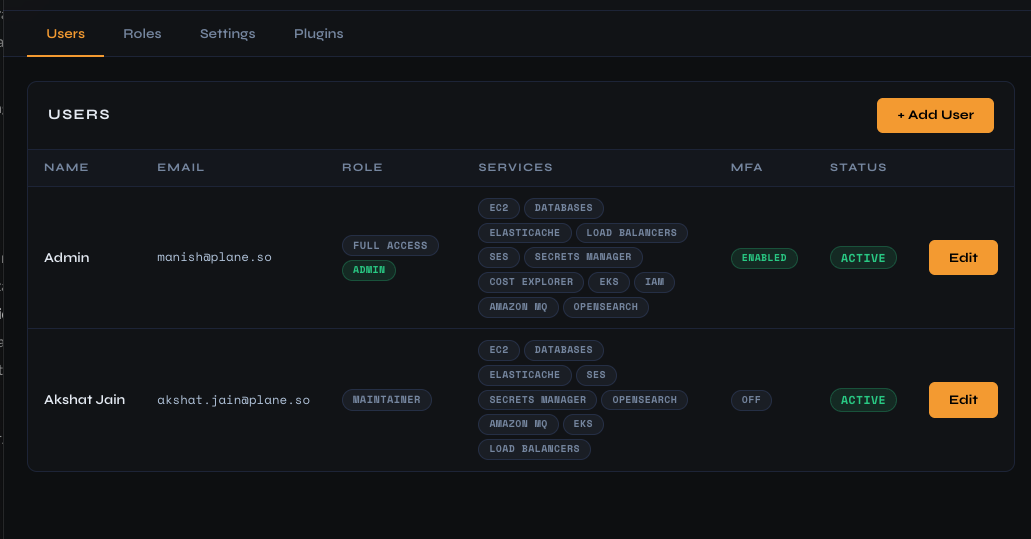
- Per-user dashboard layouts — each engineer sees what matters to them
- Auto-refresh with manual override