Introducing InfraWatch: Open-Source AWS Monitoring
InfraWatch is an open-source platform for real-time AWS infrastructure monitoring with built-in JIT access control, RBAC, MFA, and a plugin system. Here is why we built it and what it does.
If you manage AWS infrastructure, you know the pain. Monitoring tools either cost a fortune or require stitching together a dozen open-source projects. Security best practices — like temporary credentials, role-based access, and multi-factor authentication — are treated as afterthoughts rather than foundations. And the moment your team grows beyond a handful of engineers, visibility becomes a political problem as much as a technical one.
InfraWatch is our answer to all of this. It is an open-source platform that gives you real-time AWS infrastructure monitoring, secure access management, and a modular plugin system — all in one deployable package.
The Problem We Saw
We spent years working with AWS at scale. Every team we worked with faced the same challenges:
Monitoring costs are out of control. Datadog charges per host. New Relic charges per GB. Splunk charges per everything. A mid-size team running 30-50 EC2 instances, a couple of EKS clusters, and a handful of RDS databases can easily spend $50,000 to $100,000 per year on observability. For many startups and mid-size companies, that is their entire infrastructure budget.
Open-source alternatives are fragmented. Prometheus plus Grafana is powerful, but it requires configuring exporters for every service, writing PromQL queries, setting up AlertManager, and maintaining the whole stack. It works, but it is not simple.
Security is bolted on, not built in. Most monitoring tools give you dashboards but ignore the question of who should have access to what. Standing credentials, shared AWS keys, and “everyone is admin” configurations are disturbingly common.
No single tool does monitoring plus access management. Teams end up running one tool for monitoring, another for access requests, another for credential management, and yet another for audit logging. The integration tax is real.
What InfraWatch Does
InfraWatch is a single platform that handles both infrastructure monitoring and access management. Here is what ships out of the box:
Real-Time Monitoring
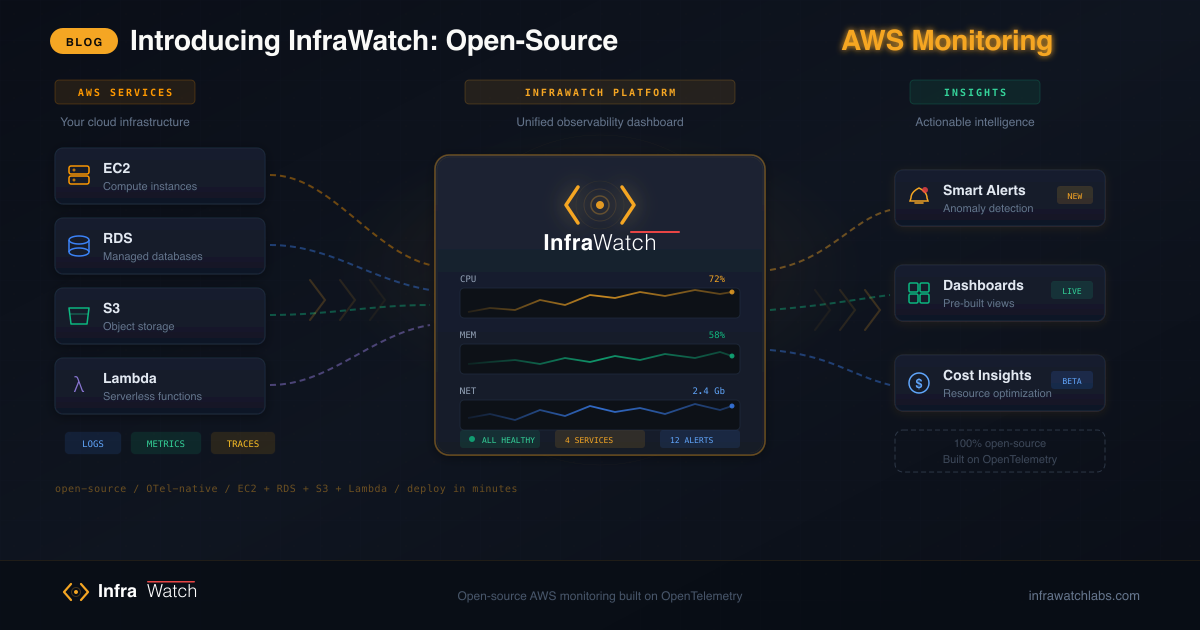
InfraWatch connects to your AWS account and pulls live status data and CloudWatch metrics for EC2 instances, RDS databases, ElastiCache clusters, DocumentDB, SES, Secrets Manager, Load Balancers, and more. Each service gets a dedicated monitoring view with the metrics that matter.
The dashboard is customizable — drag-and-drop panels, collapsible widgets, configurable time ranges, and auto-refresh intervals. Each user gets their own dashboard configuration.
JIT Access Control
Instead of giving engineers standing access to AWS, InfraWatch implements role-driven JIT access. Users are assigned roles that define which AWS services they can access and what level of permissions they receive. When access is needed, InfraWatch generates temporary AWS credentials via STS scoped to the user’s role. The credentials auto-expire, and every access event is logged.
No more shared AWS keys. No more “I need admin access for five minutes” that turns into permanent access. Every credential is scoped, temporary, and auditable.
Role-Based Access Control
Three built-in roles — Employee, Manager, and Admin — each with granular per-service permissions. Admins manage users and plugins. Managers approve access requests. Employees get monitoring access scoped to their role.
Multi-Factor Authentication
Built-in TOTP-based MFA with QR code enrollment, backup codes, and admin-enforced policies. MFA can be required for sensitive operations like accessing Secrets Manager or generating STS credentials.
Plugin System
A modular architecture with auto-discovery. Drop a plugin into the plugins directory and InfraWatch detects it automatically at startup. Seven built-in plugins ship out of the box: EKS, Cost Explorer, OpenSearch, Amazon MQ, IAM, DB Insights, and Org Dashboard. Admins activate plugins from a dedicated panel without restarting services.
The Technology
InfraWatch is built with a modern, maintainable stack:
- Backend: Python with FastAPI — async, fast, and well-documented
- Frontend: React 19 with a clean component architecture
- Worker: Celery for background metric collection
- Database: PostgreSQL for persistent storage
- Cache: Valkey (Redis-compatible) for sessions and API caching
- Deployment: Docker Compose for local/small teams, Helm charts for Kubernetes
The core platform runs in a handful of containers — with additional services like ClickHouse and the Monitor Agent collector coming online as the observability stack grows. No complex service mesh, no external dependencies beyond AWS itself.
Open Source, For Real
InfraWatch is licensed under AGPL v3. The core platform — monitoring, access management, RBAC, MFA, dashboards, and the plugin system — is free. There is no “open core” bait-and-switch where the useful features are locked behind a paywall.
We do offer a Commercial edition with enterprise features like advanced analytics and consolidated billing. But the monitoring experience that 90% of teams need is in the open-source version.
Our code is on GitHub, our roadmap is public, and our development process is transparent. We believe the best infrastructure tools are built in the open by people who actually use them.
Getting Started
You can have InfraWatch running in under five minutes:
Coming soon — The repository is not yet public. Get early access to be among the first to try it.
git clone https://github.com/infrawatchlabs/infrawatch.git
cd infrawatch
cp .env.example .env
# Edit .env with your AWS credentials and SMTP settings
docker compose up -d
Open http://localhost:3000, create your admin account, and start monitoring.
For production Kubernetes deployments, we publish official Helm charts. See our documentation for the full setup guide.
What is Next
We are actively building:
- Monitor Agent — a lightweight Go binary built on the OpenTelemetry Collector for host-level log, metric, and trace collection
- Log aggregation — centralized log search and analysis
- Distributed tracing — end-to-end request tracing across services
- Alerting engine — threshold and anomaly-based alerts with notification channels
InfraWatch is going open-source soon. Follow our roadmap for the full picture, check out the Monitor Agent, or get early access and help shape the product.