OpenTelemetry Is Becoming the Standard for Observability — Here's Why
OpenTelemetry is becoming the standard for observability. Learn why OTel is replacing proprietary agents and how to build on it.
The way teams instrument their infrastructure has fundamentally changed.
Five years ago, if you wanted observability, you picked a vendor — Datadog, New Relic, Dynatrace — and installed their proprietary agent. Your code got littered with vendor-specific SDKs. Your telemetry pipeline was locked to one destination. And switching? That meant ripping out instrumentation across every service.
That era is over. OpenTelemetry replaced it.
What is OpenTelemetry?
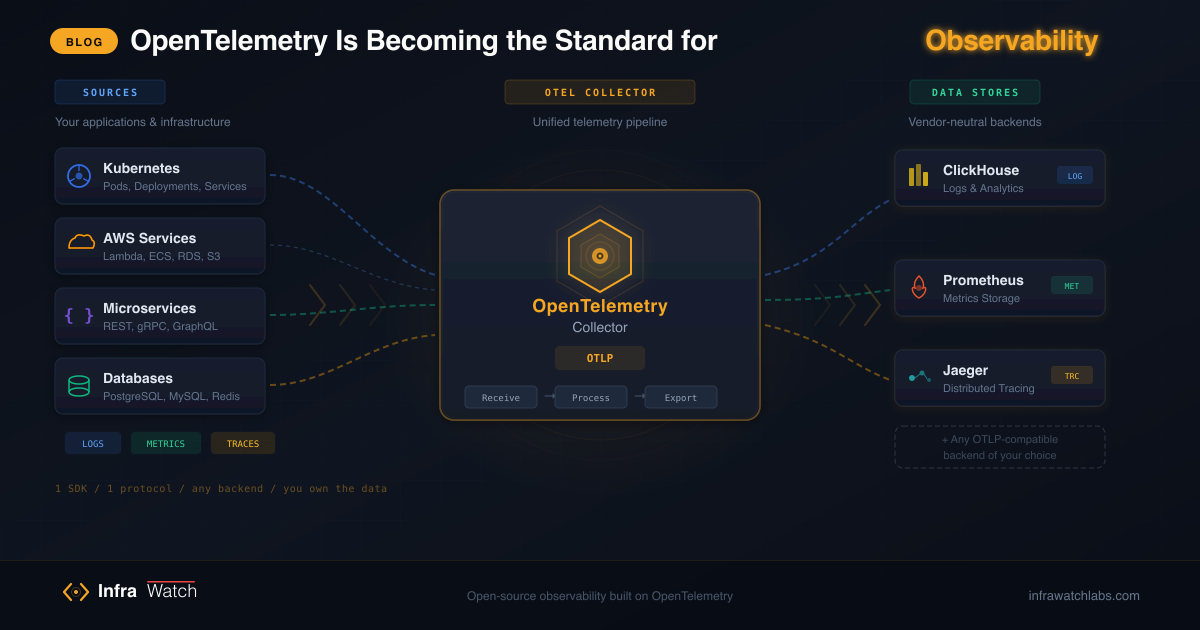
OpenTelemetry (OTel) is an open-source, vendor-neutral framework for generating, collecting, and exporting telemetry data — logs, metrics, and traces. It is a CNCF project (the second most active after Kubernetes), and it is backed by every major cloud and observability vendor.
The core idea is simple: instrument once, send anywhere.
You add OTel SDKs to your application. They generate standardized telemetry. An OTel Collector receives that telemetry and routes it wherever you want — ClickHouse, Jaeger, Prometheus, Grafana, or yes, even Datadog. The instrumentation does not change when your backend does.
Why OTel Became the Standard
1. Vendor lock-in is the number one pain point in observability
Ask any SRE what they hate most about their monitoring setup. It is not missing features — it is the feeling of being trapped.
Proprietary agents embed deep into your infrastructure. Switching from Datadog to Grafana means touching every service, every deployment, every pipeline. That migration cost keeps teams on platforms they have outgrown.
OTel eliminates this. Your instrumentation is yours. The backend is a configuration change.
2. One standard to rule them all
Before OTel, we had OpenTracing (for traces) and OpenCensus (for metrics). Both had adoption, neither had critical mass. OTel merged them into a single, comprehensive standard.
Today, OTel covers:
- Traces — stable across all major languages
- Metrics — stable and production-ready
- Logs — rapidly maturing
- Profiling — in development
One SDK. One Collector. One protocol (OTLP). Every signal type.
3. The ecosystem is massive
OTel is not just a spec on paper. The Collector alone has 200+ receivers, processors, and exporters. You can ingest data from:
- Kubernetes pods and nodes
- AWS CloudWatch
- Nginx, Apache, MySQL, PostgreSQL
- Custom application metrics
- Syslog, journald, file-based logs
And export to virtually any backend. The ecosystem is so rich that most vendors now recommend OTel instrumentation over their own agents.
4. Cloud providers are going all-in
AWS Distro for OpenTelemetry (ADOT). Google Cloud’s OpenTelemetry support. Azure Monitor’s OTel integration. When the hyperscalers adopt a standard, it is settled.
The Catch: OTel Does Not Include a Backend
Here is what people miss about OpenTelemetry: it is a telemetry pipeline, not an observability platform.
OTel will collect your logs, metrics, and traces beautifully. But it will not store them. It will not visualize them. It will not alert on them.
You still need:
- A storage engine for time-series and log data
- A query layer for searching and filtering
- Dashboards for visualization
- Alerting for when things break
This is where teams end up building Frankenstein stacks — Prometheus for metrics, Loki for logs, Tempo for traces, Grafana for dashboards, AlertManager for alerts. Five tools, five configs, five scaling challenges.
What We Are Building at InfraWatch
We asked: what if the backend was as simple as the instrumentation?
InfraWatch is a self-hosted observability platform built from the ground up for OpenTelemetry:
- OTel Collector receives all telemetry via OTLP — the standard protocol
- ClickHouse stores everything — logs, metrics, traces — in a single, blazing-fast columnar database
- Unified UI lets you search logs, explore metrics, and trace requests — without switching tabs
- Self-hosted — your data stays in your infrastructure, on your terms
No proprietary agents. No per-host pricing. No data leaving your network.
Instrument with OTel. Point it at InfraWatch. Done.
The Standard Is Here
OpenTelemetry is not a trend or an emerging technology — it is the foundation most modern observability stacks are already built on. If your team has not adopted it yet, you are not early — you are late.
The question is not whether to adopt OTel. It is what you point it at.
InfraWatch is an open-source, self-hosted Infrastructure Intelligence Platform. See everything. Control access. Start with AWS.
Learn more at infrawatchlabs.com